Label Parameters


Label definitions are used extensively throughout NetCharts in order to display titles, legends, axis tics, data labels, etc. The following label parameters are supported by one or more of the charts:
DwellLabel  =  ("Label", Color, "FontName", FontSize, Angle, Alignment, External Justification);
Header     =  ("Label", Color, "FontName", FontSize, Angle, Alignment, External Alignment, Extend);
Footer     =  ("Label", Color, "FontName", FontSize, Angle, Alignment, External Alignment, Extend);
LeftTitle  =  ("Label", Color, "FontName", FontSize, Angle, Alignment, External Alignment, Extend);
RightTitle =  ("Label", Color, "FontName", FontSize, Angle, Alignment, External Alignment, Extend);
Legend     =  ("Label", Color, "FontName", FontSize, Angle, Alignment);
All of the attributes are optional. If they are not specified, default values will be used, depending on the specific parameter being defined.

The attributes are interpreted as follows:

"Label"

The given string is used as the value of the label being displayed. If the string contains the "\n" (newline) character than the label will be displayed on multiple lines.

Color The color of the font used for the label.
FontName The font to be used for the label. The exact list of font styles is platform dependent, but the following font styles are guaranteed to be available for any Java implementation:
Java font X-11 font Windows Font
default misc-fixed Arial
Helvetica adobe-helvetica Arial
TimesRoman adobe-times Times New Roman
Courier adobe-courier Courier New
Dialog b&h-lucida MS Sans Serif

Font names can be augmented with additional font style information. Adding "Plain" ,"Bold" or "Italic" to the font name modifies the style as specified. For example "Courier Bold Italic" is a valid font name specification. By default NetCharts chooses a BOLD style for the specified font so "TimesRoman" is equivalent to "TimesRoman Bold". To get a standard version of a font, add "Plain" to the name.

Font names can also be augmented with "underline", "overline", "linethrough", "ascent=N", "descent=N", "leading=N" and "maxLineAdvance=N".

Any combination of style modifiers is allowed. For example "TimesRoman Plain Italic underline overline linethrough ascent=10 descent=0 leading=-15" is a valid font specification which uses a nonbold italic type, draws a line above, below and through the text, and controls the amount of space allocated for character ascents, descents and the space between consecutive lines.

maxLineAdvance specifies the maximum length (in pixels) NetCharts will allow a string using this font specification to be before it wraps to a new line.

FontSize This attribute defines the point size of the font. The available values depend on the font style defined and the platform.
Angle This attribute defines the angle of rotation (in degrees) for the entire label, see the example below. If a nonzero value is specified, the label will be rotated counterclockwise by that many degrees before being rendered.
Alignment This attribute defines how the text of the label will be aligned or justified.
  LEFT - Align the text to the left within the text area.
  CENTER - Center the text within the text area.
  RIGHT - Align the text to the right within the text area.
External Alignment This attribute defines how the label will be aligned versus other chart objects.
  LEFT - Align the label to the left versus other chart objects or the axis.
  CENTER - Center the label versus other chart objects or the axis.
  RIGHT - Align the label to the right versus other chart objects or the axis.
  TOP - Align the label to the top versus other chart objects or the axis.
  BOTTOM - Align the label to the bottom versus other chart objects or the axis.
Extend This attribute allows title backgrounds to extend the entire length or height of the chart. Legal values are ON or OFF. The default value is OFF.


TitleSpacing

	TitleSpacing = number;

TitleSpacing is specified in pixels and defines the amount of space between an extended title and the border of the chart. The default value is 5. A value of 0 will allow the title background to extend to the border of the chart. The parameter is only relevant when a title has its extend attribute set ON.


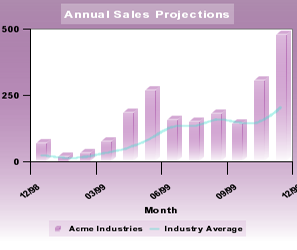
NetCharts can draw text rotated to any angle. The chart example below rotates the bottom tics at a 45 degree angle and uses the following parameter syntax:

 BottomTics = ("ON",black,"Helvetica",9,45);


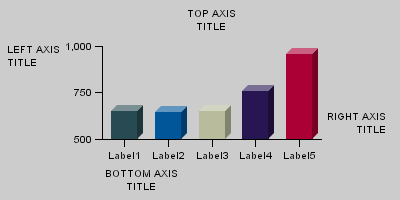
The text of a label or labels themselves can be aligned. The chart example below shows the bottom axis title externally aligned to the left, the left axis title externally aligned to the top with the text aligned to the left and the right axis title externally aligned to the bottom with the text aligned to the right. These were done using the following parameter syntax:

 RightAxisTitle = ("RIGHT AXIS\nTITLE", black, "Arial Plain", 10, 0, RIGHT, BOTTOM);
 BottomAxisTitle = ("BOTTOM AXIS\nTITLE", black, "Arial Plain", 10, 0, null, LEFT);
 TopAxisTitle = ("TOP AXIS\nTITLE", black, "Arial Plain", 10, 0, null, CENTER);
 LeftAxisTitle = ("LEFT AXIS\nTITLE", black, "Arial Plain", 10, 0, LEFT, TOP);


LabelAnimationStyle

	LabelAnimationStyle = FADE | NONE;

Defines how axis and data labels initially appear in a chart. This parameter is only valid in SVG and SVGweb output formats.

   example: LabelAnimationStyle = FADE;

FADE

The labels fade in.

NONE

The labels are immediately visible.