Date/Time ValuesNetCharts supports the use of Date/Time
values for one or more values in a data set value. TopFormat = (DATE, "DateFormat", "TimeBase", "TimeUnit"); BottomFormat = (DATE, "DateFormat", "TimeBase", "TimeUnit"); LeftFormat = (DATE, "DateFormat", "TimeBase", "TimeUnit"); RightFormat = (DATE, "DateFormat", "TimeBase", "TimeUnit");while the following parameters accept date/time values as data values: TopScale = (MinValue, MaxValue, StepValue); BottomScale = (MinValue, MaxValue, StepValue); LeftScale = (MinValue, MaxValue, StepValue); RightScale = (MinValue, MaxValue, StepValue); TopScroll = (ScrollMin, ScrollMax); BottomScroll = (ScrollMin, ScrollMax); LeftScroll = (ScrollMin, ScrollMax); RightScroll = (ScrollMin, ScrollMax); DataSet[1-20] LineSet[1-20] Date/Time value processing is enabled by setting a given axis type to DATE. The date values associated with that axis will then be processed as date/time values. Specifically, that means any data value associated with that axis can be input in any of the following formats: Regardless of how the date/time value is entered as a data value, the display of the value, either as a tic mark label or an active label, will be rendered using the FormatExpr attribute specified in the TopFormat, BottomFormat, LeftFormat or RightFormat parameters. See Axis Parameters for more details concerning date label formatting.
Absolute Date ExpressionAn Absolute Date Expression is any quoted string that represents a date and/or time in some standard convention. Java automatically recognizes many date/time formats, including the following:
(You
may find other input formats are also recognized.)
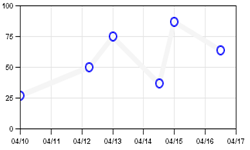
Absolute Date Expressions are best used for specifying the min or max values in an axis range, or when specifying an exact time-based data value. The following expressions are valid Absolute Date Expressions: 1 Jan 2000 12:30 Jan 1, 2000 12:30 Wed, 10 Apr 00 This example shows an XY chart with the X values specified as absolute date expressions.
BottomFormat = (DATE, "%M/%D");
BottomScale  = ("10 Apr 00", "17 Apr 96");
DataSet1     = ("10 Apr 00",       27),
               ("12 Apr 00 05:30", 50),
               ("4/13/2000",       75),
               ("4/14/00 12:30",   37),
               ("April 15, 00",    87),
               ("Apr 16, 00 12:00",64);
Relative Time UnitYou may want to specify a date/time value that is relative to another. For example, a measurement might be taken 20 minutes after the start of an experiment, or a task might end 5 days and 6 hours after the start of the task. In such cases, a Relative Time Unit can be entered, using the following syntax: Relative Time Unit = "1Y 2M 3d 12h 30m";where all of the components are optional and are interpreted as follows:
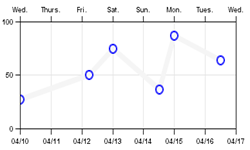
For example, the following expression represents a date that is 1 week after the base date: "7d"while the following expression represents a date/time that is 3 days, 12 hours and 30 minutes after the base date/time: "3d 12h 30m" The absolute date/time represented by a given relative time unit is determined as follows: Absolute DateTime = Axis TimeBase + Relative Time Unit where TimeBase is defined in the Format parameter for the corresponding axis. For example, the following parameters specify the same axis and data values as above, except that they use Relative Time Unit values: BottomFormat = (DATE, "%M/%D", "10 Apr 00");
BottomScale = ("0d", "7d");
DataSet1 = ("0d", 27),
("2d 5h 30m", 50),
("3d", 75),
("4d 12h 30m", 37),
("120h", 87),
("6d 12h", 64);
Note, the TimeBase attribute of the BottomFormat parameter is used to "anchor" the graph on a given starting date, all other date/times are relative to that base date. Also, note how the April 15 value is specified as 120 hours (5 days) past the base date. |

