Axes Parameters
NetCharts supports the definition and display of one or more axes, depending on the specific chart type.
NetCharts Axes parameters can be used to create Standard Axes, Multi-Scaled Single Axes, Variable Axis Labeling and Multiple Axes in a Single Dimension.
Axes CategoriesStandard AxesAn Axis line can have many functions. An axis line provides a reference for measuring coordinates. The line of an axis also provides a way for displaying Tic marks and Scales. NetCharts allows for the zero base line of an axis to be located at the Top, Bottom, Left and Right of the chart. Moreover, you can have a series of Axes and a series of Scale Sets on one line.
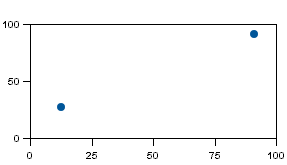
CDL Example:
      LeftTics = ("ON",black,"SansSerif",10,null,null)
      BottomTics = ("ON",black,"SansSerif",10,null,null)
      LineSet1 = (12.5,27),(91,91)
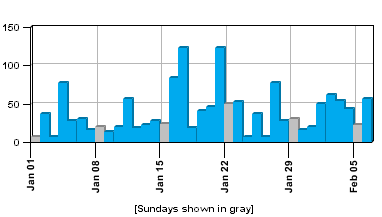
Multi-Scaled Single AxesCDL parameters for axes allow a single axis to have multiple scales. For example, the chart displayed below has a botom axis with two scales. The number of scales an axis can have is theoretically unlimited although it will be practically bounded by the size of the chart.
CDL Example:
     BottomTics = ("ON",black,"SansSerif",10,90,null);
     LeftTics = ("ON",null,"SansSerif",10,0,null);
     BottomFormat = (DATE,"%n %d","01-Jan-2001 12:01:00","1D");
     Footer = ("[Sundays shown in gray]",black,"SansSerif",10,0);
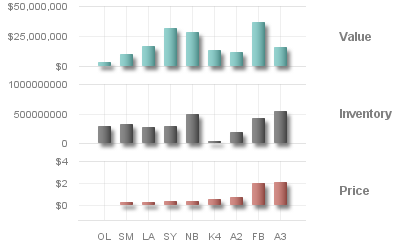
Multiple Axes in a Single DimensionThis feature allows multiple axes to be defined in the same physical space that is usually occupied by a single axis. In other words, one can define multiple left, top, bottom or right axes. Each axis can be independently defined and controlled. Up to 10 axes can be defined in each dimension. The parameters that define each additional axis are the same as the standard axis parameters with the exception of a number at the end.
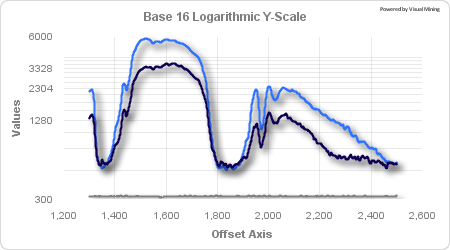
Logarithmic AxesThe NetCharts rendering engine supports logarithmic axes. X and Y axes can be logarithmic.
    LeftScaleMode1 = (LOG,16.0);
    LeftScale1 = (300.0,6000.0,1000.0);
Using LOG requires that the scale minimum be non-zero;
Variable Axis LabelingThis feature allow additional control over axis tic mark drawing and labeling. The drawing on each tic mark on an axis can be specifically enabled or disabled. There are 4 new CDL parameters for variable tic labeling, one for each axis location.
Axes Parameters
|
||||||||||||||||||||||||||||||||||||||||||||||||||||||||||||||||||||||||||||||||||||||||||||||||||||||||||||||||||||||||||||||||||||||||||||||||||||||||||||||||||||||||||||||||||||||||||||||||||||||||||||||||||||||||||||||||||||||||||||||||||||||||||||||||||||||||||||||||||||||||||||||||||||||||||||||||||||||||||||
| Key Pressed | Action Taken |
| Left Arrow | The Bottom/Top axis will be stepped by one tick mark to the left. |
| Right Arrow | The Bottom/Top axis will be stepped by one tick mark to the right. |
| Up Arrow | The Left/Right axis will be stepped by one tick mark up. |
| Down Arrow | The Left/Right axis will be stepped by one tick mark down. |
| PageDown | All axes will zoom IN by a factor of 2. |
| PageUp | All axes will zoom OUT by a factor of 2. |
| Home, End | All axes will zoom OUT to their maximum specified values. |
In addition to the keyboard interaction, the following mouse interactions are supported:
| Mouse Action | Action Taken |
| Press and hold mouse button within the chart and drag the mouse while holding the button down | A rubber band box will appear while the mouse is dragged around. When the mouse button is released, the chart will zoom IN to show the region highlighted by the box. If the ESCAPE key is pressed during the drag operation, the zoom will be aborted. |
| Press mouse button within the chart while holding SHIFT key. | All axes will zoom IN by a factor or 2. |
| Press mouse button within the chart while holding CONTROL key. | All axes will zoom OUT by a factor or 2. |
| Press mouse button over a single slider bar while holding SHIFT key. | Only that axis will zoom IN by a factor or 2. |
| Press mouse button over a single slider bar while holding CONTROL key. | Only that axis will zoom OUT by a factor or 2. |
| Press and hold mouse button over a single slider bar and drag the mouse in either direction. | When the mouse is released, only that axis will scroll to the location specified by the slider bar. |
| Press mouse button one either side of a single slider bar. | Only that axis will step by one tick mark in the given direction. |
Java programmers can
specify the exact behavior of mouse event processing with
regard to zooming through the following instance variables
in the NFGraph class:
| Variable | Possible Values |
| mouseShiftDown | NOZOOM, ZOOMIN (default), ZOOMOUT |
| mouseControlDown | NOZOOM, ZOOMIN, ZOOMOUT (default) |
| mouseMetaDown | NOZOOM, ZOOMIN, ZOOMOUT (default) |
| zoomAction | Event.MOUSE_UP, Event.MOUSE_DOWN (default) |
The mouseXXXDown variables define the zoom action taken whenever the mouse is clicked within the graph region and the user is holding down either the Shift, Control or Meta keys. (The meta-down mouse event is generated by the right-mouse button.)
The zoomAction variable specifies whether the zoom actions should be performed on the DOWN or UP mouse events.
Axis Thickness
 	AxisThickness = thickness;


        example:  AxisThickness = 15;
If thickness is greater than 1, then all axes will be displayed in 3D with the given thickness. This 3D look will only be active when one or more 3D grids have been specified.
The default value is 0.
Axis Title Active Label Parameters
   TopAxisTitleActiveLabel[N] = ("Label", "URL", "Target");
   BottomAxisTitleActiveLabel[N] = ("Label", "URL", "Target");
   LeftAxisTitleActiveLabel[N] = ("Label", "URL", "Target");
   RightAxisTitleActiveLabel[N] = ("Label", "URL", "Target");

        example: TopAxisTitleActiveLabel2 = ("","BarchartEx.html","InfoFrame");
The AxisTitleActiveLabel parameter specifies a custom active label to be associated with the axis title. That is, these labels will be displayed whenever the mouse "dwells" over the axis title. This can be used to provide the user with additional information about that particular value or to "drill-down" to another document. See Active Labels for a detailed explanation of active label capabilities.
[N] represents the nth axis in the given, (top, bottom, left, right), axes series. For example, BottomAxisTitleActiveLabel2 is the axis title active label of the 2nd bottom axis. BottomAxisTitleActiveLabel and BottomAxisTitleActiveLabel1 are considered the same for backward compatibility.
Axis Title Box/Region Parameters
   TopAxisTitleBox[N] = (Color, BorderType, BorderWidth, "ImageURL", ImageFormat, BorderColor, TRCornerStyle, BRCornerStyle, BLCornerStyle,
CornerColor);
   BottomAxisTitleBox[N] = (Color, BorderType, BorderWidth, "ImageURL", ImageFormat, BorderColor, TRCornerStyle, BRCornerStyle, BLCornerStyle,
CornerColor);
   LeftAxisTitleBox[N] = (Color, BorderType, BorderWidth, "ImageURL", ImageFormat, BorderColor, TRCornerStyle, BRCornerStyle, BLCornerStyle,
CornerColor);
   RightAxisTitleBox[N] = (Color, BorderType, BorderWidth, "ImageURL", ImageFormat, BorderColor, TRCornerStyle, BRCornerStyle, BLCornerStyle,
CornerColor);


        example: TopAxisTitleBox2 = (black,RAISED,3,"BarchartEx.html",10);
The AxisTitleBox parameter specifies the region attributes for the axis title centered along the axis. See Region Parameters for more details concerning region attributes.
[N] represents the nth axis in the given, (top, bottom, left, right), axes series. For example, BottomAxisTitleBox2 is the axis title box region of the 2nd bottom axis. BottomAxisTitleBox and BottomAxisTitleBox1 are considered the same for backward compatibility.
Axis Title Label Parameters
   TopAxisTitle[N] = ("Label", Color, "Font", FontSize, FontAngle, interiorAlignment, exteriorAlignment);
   BottomAxisTitle[N] = ("Label", Color, "Font", FontSize, FontAngle, interiorAlignment, exteriorAlignment);
   LeftAxisTitle[N] = ("Label", Color, "Font", FontSize, FontAngle, interiorAlignment, exteriorAlignment);
   RightAxisTitle[N] = ("Label", Color, "Font", FontSize, FontAngle, interiorAlignment, exteriorAlignment);

       example: TopAxisTitle2 = ("Finanical Status",black,"Helvetica",10,0);
The AxisTitle parameter specifies the label attributes for the axis title centered along the axis. See Label Parameters for more details concerning label attributes.
[N] represents the nth axis in the given, (top, bottom, left, right), axes series. For example, BottomAxisTitle2 is the axis title of the 2nd bottom axis. BottomAxisTitle and BottomAxisTitle1 are considered the same for backward compatibility.
AxesGaps Parameters
   TopAxesGaps = value, value, ...;
   BottomAxesGaps = value, value, ...;
   LeftAxesGaps = value, value, ...;
   RightAxesGaps = value, value, ...;


        example: TopAxesGaps = 2;
The AxesGaps parameter is used to specify the percentage of available space that should be allocated for gaps between axes. This parameter is used in conjunction with AxesLayout. The values specified in AxesLayout and AxesGaps are summed and each axis and gap is drawn in a space relative to its contribution to that sum. For Example LeftAxisLayout=20,40,20 and LeftAxisGaps=10,10 would assign 20% of the axis space to Axis1, 10% to the gap between Axis1 and Axis2, 40% to Axis2, 10% to the gap between Axis2 and Axis 3 and 20% to Axis3.
Color Parameters
   TopColor[N] = AxisColor;
   BottomColor[N] = AxisColor;
   LeftColor[N] = AxisColor;
   RightColor[N] = AxisColor;


       example: TopColor2 = blue;
The Color parameter is used to specify the color of the axis line and the tic marks, but not the tic mark labels. The default axis line and tic color is black. If the null color is specified, the axis color is not changed by this parameter.
[N] represents the nth axis in the given, (top, bottom, left, right), axes series. For example, LeftColor2 is the color of the 2nd left axis. LeftColor and LeftColor1 are considered the same for backward compatibility.
Labels Parameters
	TopLabels[N] = "Label1", "Label2", ...;
	BottomLabels[N] = "Label1", "Label2", ...
	LeftLabels[N] = "Label1", "Label2", ...
	RightLabels[N] = "Label1", "Label2", ...

        example: BottomLabels2 = "M1", "M2", "M3";
                       BottomLabels3 = "N1", "N2", "N3";
The Labels parameter specifies a list of custom tic mark labels, that will be used instead of the numeric labels automatically generated by the axis. The Labels will be evenly placed along the axis, overriding any tic placement specified by the StepValue attribute.
In a Bar/Combo/Stock Chart, the BarLabels parameter overrides the BottomLabels (for VERTICAL bars) or the LeftLabels (for HORIZONTAL bars) parameters.
[N] represents the nth axis in the given, (top, bottom, left, right), axes series. For example, LeftColor2 is the color of the 2nd left axis. LeftColor and LeftColor1 are considered the same for backward compatibility.
PlotArea
	PlotArea = (xlocation, ylocation, width, height);

        example: PlotArea = (1, 1, 1, 1);
If PlotArea is defined in relative terms (as a percentage of the chart size) the PlotArea will grow and shrink proportionally with changes to the chart size. Text in the top, bottom, left or right will be clipped if it does not fit in the space outside the plot area.
-
xLOCATION – x coordinate of the upper left corner of the plot area within the chart. If xlocation is a number between 0 and 1, it is interpreted as a percentage of the total available chart width. If xlocation is >= 1, it is interpreted as an absolute location in pixels.
-
yLOCATION – y coordinate of the upper left corner of plot area within the chart. If ylocation is a number between 0 and 1, it is interpreted as a percentage of the total available chart height. If ylocation >= 1 it is interpreted as an absolute location in pixels.
-
WIDTH – width of plot area. If width is a number between 0 and 1, it is interpreted as a percentage of the total available chart area. If width >= 1 it is interpreted as an absolute size in pixels.
-
HEIGHT - width of plot area. If height is a number between 0 and 1, it is interpreted as a percentage of the total available chart height. If height >= 1 it is interpreted as an absolute size in pixels.
AxesSizes
	AxesSizes = (bottomsize, topsize, leftsize, rightsize);

        example: AxesSizes = (1, 1, 1, 1);
AxesSizes specifies the amount of space that will be allocated to draw top, bottom, left and right axes. AxesSizes is typically used in conjunction with PlotArea to further control the layout of the PlotArea of a chart.
-
BOTTOMSIZE– amount of vertical space in chart allocated to the bottom axes. If bottomsize is a number between 0 and 1, it is interpreted as a percentage of the total plot area height. If bottomsize >= 1 it is interpreted as an absolute size in pixels.
-
TOPSIZE– amount of vertical space in chart allocated to the top axes. If topsize is a number between 0 and 1 it is interpreted as a percentage of the total plot area height. If topsize >= 1 it is interpreted as an absolute size in pixels.
-
LEFTSIZE– amount of horizontal space in chart allocated to the left axes
If leftsize is a number between 0 and 1, it is interpreted as a percentage of the total plot area width. If leftsize >= 1 it is interpreted an an absolute size in pixels. -
RIGHTSIZE– amount of space in chart allocated to the right axes
If rightsize is a number between 0 and 1 it is interpreted as a percentage of the total plot area width. If rightsize >= 1 it is interpreted an an absolute size in pixels.
ChartElementSpacing
	ChartElementSpacing = spacing;

        example: ChartElementSpacing = 2;
ChartElementSpacing represents the size in pixels of the horizontal and vertical space between chart elements.
Scale Parameters
	TopScale[N] = (MinValue, MaxValue, StepValue);
        BottomScale[N] = (MinValue, MaxValue, StepValue);
        LeftScale[N] = (MinValue, MaxValue, StepValue);
        RightScale[N] = (MinValue, MaxValue, StepValue);

        example: TopScale = (0,100,10);
The Scale parameter specifies the minimum and maximum data
values which will be displayed along the axis. If the Scale
parameter is not defined then the tic mark locations will be
automatically determined based on the actual data values being
displayed. That is, the axis will be "autoscaled"
using the current data values to determine "reasonable"
values for MinValue, MaxValue and StepValue.
Any combination of MinValue, MaxValue and StepValue may be
defined. Those attributes that are not defined will have "reasonable"
values chosen for them.
If the StepValue is defined but not as an even multiple of
the difference between the MinValue and MaxValue, then no tic
mark will be displayed at the Max Value.
Note:
In some charts, the Scale parameter is ignored for a given axis.
For example, in the BarChart, the BottomScale attributes are
automatically determined by the number of bars being displayed.
Note:
The TopScale and BottomScale parameters are not supported in
Strip Charts.
ScaleMode Parameters
	TopScaleMode[N] = (mode,logBase), (mode,logBase),...;
    	BottomScaleMode[N] = (mode,logBase), (mode,logBase),...;
    	LeftScaleMode[N] = (mode,logBase), (mode,logBase),...;
    	RightScaleMode[N] = (mode,logBase), (mode,logBase),...;

     example: TopScaleMode2 = (LOG,2);
         example: BottomScaleMode = (LINEAR);
The ScaleMode parameter is used to specify which scale mode should be used on a given axis.
| LINEAR | Use a Linear scale mode (base unused) |
| LOG | Use a Logarithmic scale mode with log base = logBase |
[N] represents the nth axis in the given, (top, bottom, left, right), axes series. For example, TopScaleMode2 is the scale mode of the 2nd top axis. TopScaleMode and TopScaleMode1 are considered the same for backward compatibility. The default value for the scalemode parameter is LINEAR.
AxisZoom
	BottomZoom[N] = ON | OFF
	LeftZoom[N] = ON | OFF
	RightZoom[N] = ON | OFF
	TopZoom[N] = ON | OFF
When AxisZoom = ON, clicking and dragging a rectangle over a chart will zoom with respect to that axis on the chart. This zoom operation does not require the axis to be scrollable.
example: LeftZoom = ON;
RubberbandFill
RubberbandFill = color;
Defines the color of the rubberbanded box created by clicking and dragging a zoom rectangle.
example: RubberbandFill = yellow_100;
RubberbandBorderStyle
RubberbandBorderStyle = (linetype, linewidth, linecolor);
Defines the borderstyle to apply to the rubberbanded box created by clicking and dragging to create zoom rectangle. The linewidth defaults to 1 pixel. The linecolor defaults to black.
example: RubberbandBorderStyle = (DASHED,2,YELLOW);
| SOLID |
A solid line is displayed (default). |
| DOTTED | A dotted line is displayed. |
| DASHED | A dashed line is displayed. |
| DOTDASH | Alternating dots and dashes are displayed. |
ScaleSet Parameters
	TopScaleSet[N] = (min, max, step, percentage),...;
    	BottomScaleSet[N] = (min, max, step, percentage),...;
    	LeftScaleSet[N] = (min, max, step, percentage),...;
    	RightScaleSet[N] = (min, max, step, percentage),...;


          example: TopScaleSet = (0,600,100,60);
                         TopScaleSet2 = (600,1000,60);
The ScaleSet parameter is used to specify a series of contiguous scales (minimum, maximum, and step size) to be used on an axis.
| Min | The minimum value of the scale |
| Max | The maximum value of the scale |
| Step | The tic step size within the scale |
| Percentage | The percentage of available space this scale should occupy |
[N] represents the nth axis in the given, (top, bottom, left, right), axes series. For example, TopScaleSet2 is the scale set of the 2nd Top axis. TopScaleSet and TopScaleSet1 are considered the same for backward compatibility.
Note that all scale minimums must be equal to the previous scale's maximum in the same axis. Also, the scaleset parameter can not be used with a Logarithmic scale mode.
AutoscalePad
AutoscalePad=N;
AutoscalePad specifies a hint to the Netcharts logic that is used to automatically determine an axis range. When no AxisScale parameters are specified for an axis, the axis automatically chooses a range based on the data values that are being plotted. Autoscalepad can be used to control these automatically choosen values.
AutoscalePad is specified as a percentage of the data range. For example, if a data series has a minimum value of 100 and a maximum value of 200, NetCharts will auto scale the axis to range from 100 to 200. If in addition AutoscalePad=10 is specified, NetCharts will autoscale the axis to start at 10% below 100 and end at 10% above 200. If a minimum of maximum value is the data series is 0, that value will not be modified by AutoscalePad.
Tics Parameters
        TopTics[N] = ("Mode", Color, "Font", FontSize, FontAngle, interiorAlignment,backgroundColor,rotationPoint);
        TopTicLength[N] = ("Mode", Color, "Font", FontSize, FontAngle, interiorAlignment,backgroundColor,rotationPoint);
  	BottomTics[N] = ("Mode", Color, "Font", FontSize, FontAngle, interiorAlignment,backgroundColor,rotationPoint);
   	LeftTics[N] = ("Mode", Color, "Font", FontSize, FontAngle, interiorAlignment,backgroundColor,rotationPoint);
   	RightTics[N] = ("Mode", Color, "Font", FontSize, FontAngle, interiorAlignment,backgroundColor,rotationPoint);

        example: TopTics3 = ("ON",black,"Helvetica",10);
The Tics parameter specifies the label attributes for the tic marks displayed along the axis. If TicMode is "OFF", then the tic marks will not be displayed, otherwise the tic labels will be generated based on the other parameter settings and will be displayed using the given label attributes in the Tics parameter. If any attribute is not defined, the previous value of that attribute will be used. See Label Parameters for more details concerning label attributes.
The rotationPoint specifies which end of a tic label (right or left) will be used to rotate the axis labels. The default is right.
[N] represents the nth axis in the given, (top, bottom, left, right), axes series. For example, BottomTics2 specifies the label attributes for the tic marks of the 2nd bottom axis. BottomTics and BottomTics1 are considered the same for backward compatibility.
TicLength Parameters
        BottomTicLength = Length;
        LeftTicLength = Length;
  	RightTicLength = Length;
   	TopTicLength = Length;

        example: TopTicLength = 10;
The TicLength parameter specifies the size of axis tic marks which are displayed. The value defines the number of pixels to use for the length of the tic mark. Setting the value to -1 will default the tic length to the number of pixels used for the width of the character zero (0) as found in the font applied to the label.
TicLayout Parameters
	TopTicLayout[N] = (Mode, SkipCount, StaggerLevels);
   	BottomTicLayout[N] = (Mode, SkipCount, StaggerLevels);
   	LeftTicLayout[N] = (Mode, SkipCount, StaggerLevels);
   	RightTicLayout[N] = (Mode, SkipCount, StaggerLevels);

       example:  TopTicLayout2 = (AUTOSTAGGER,5,3);
The TicLayout parameter is normally used in cases where the tic axis labels may overlap if not adjusted.
The Mode attribute indicates the type of layout mode that should be used, with the following modes currently supported:
| NORMAL | The default mode specifies that no explicit layout processing should occur. |
| AUTO | Insures that labels never overlap. If labels are overlapping, it automatically staggers labels up to the number of levels defined in the StaggerLevels parameter (by default 2). If the labels still overlap, even after staggering, labels will be automatically skipped at a constant interval until none overlap. |
| AUTOSKIP | Indicates the axis labels should be automatically skipped at a constant interval if (and only if) they overlap. |
| AUTOSTAGGER | Indicates that axis labels should be automatically staggered up to the number of levels defined in the StaggerLevels parameter, if (and only if) they overlap |
| SKIP | Indicates that a certain number of axis tics should be skipped, and uses the SkipCount parameter to determine that number. (by default 1) |
| STAGGER | Indicates that axis labels should be staggered, using the number of levels defined in the StaggerLevels parameter. (by default 2) |
| SKIPSTAGGER | Indicates that axis labels should be skipped and staggered, using the SkipCount and StaggerLevels parameters. (by default 1 and 2) |
The SkipCount parameter, if greater than zero, is used to determine the number of tics that should be skipped should the Mode be set to SKIP.
The StaggerLevels parameter is used to determine the number of "levels" axis labels can or should be staggered to.
MajorTicColor Parameters
	TopMajorTicColor[N] = color;
   	BottomMajorTicColor[N] = color;
   	LeftMajorTicColor[N] = color;
   	RightMajorTicColor[N] = color;
example: TopMajorTicColor2 = red;
The MajorTicLayour parameter controls the color of the major tics on the specified axis.
MinorTicColor Parameters
	TopMinorTicColor[N] = color;
   	BottomMinorTicColor[N] = color;
   	LeftMinorTicColor[N] = color;
   	RightMinorTicColor[N] = color;
example: LeftMinorTicColor = green;
The MinorTicLayour parameter controls the color of the minor tics on the specified axis.
TicLocations Parameters
      TopTicLocations = value, value, value, ...;
      BottomTicLocations = value, value, value, ...;
      LeftTicLocations = value, value, value, ...;
      RightTicLocation = value, value, value, ...;
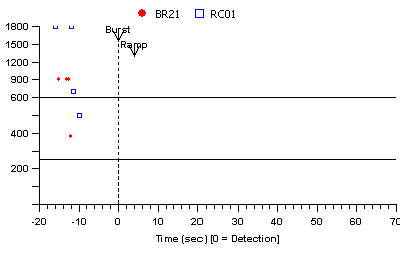
              example: LeftTicLocations = 0,100,200,300,400,500,600,900,1200,1500,1800;
                             LeftLabels = null, null, 200, null, 400, null, 600, 900, 1200, 1500, 1800;
The corresponding Labels parameter can be used in conjunction
with the TicLocations parameter for complete control of tic
drawing and tic labeling. The TicLocations parameter defines the specific locations
where the labels in the corresponding Labels parameter should be drawn. For example, the chart below is Multi-Scaled
and has a Variably Labeled Axis. the left axis has tic marks
drawn at 10 locations, while only 7 of those tics are labeled.
This was accomplished by using the example LeftTicLocations and
LeftLabels parameters above.
DrawMinorTics
      TopDrawMinorTics = ON | OFF;
      BottomDrawMinorTics = ON | OFF;
      LeftDrawMinorTics = ON | OFF;
      RightDrawMinorTics = ON | OFF;
example: TopDrawMinorTics = OFF;
The DrawMinorTics parameter specifies whether or not to draw minor tics..
Axes Numeric Formats
Format Parameters
TopFormat[N] = (FormatType, "FormatExpr", "TimeBase", "TimeUnit"); BottomFormat[N] = (FormatType, "FormatExpr", "TimeBase", "TimeUnit");[N] represents the nth axis in the given, (top, bottom, left, right), axes series. For example, LeftFormat2 is the format of the 2nd left axis. LeftFormat and LeftFormat1 are considered the same for backward compatibility.
LeftFormat[N] = (FormatType, "FormatExpr", "TimeBase", "TimeUnit");
RightFormat[N] = (FormatType, "FormatExpr", "TimeBase", "TimeUnit"); example: LeftFormat = (FLOAT, "%.2f");
The numeric labels that are automatically generated by the axis can be formatted using the Format parameter. The FormatType attribute specifies the type of number being displayed by that axis, with the following types currently supported:
- FLOAT
- INTEGER
- DATE
- SIMPLEDATE
- DECIMAL
The FLOAT type specifies that the numeric values should be displayed with decimal parts, while the INTEGER type specifies that the numeric values should be displayed as integers, rounded if necessary. The DATE type specifies that the axis tic values should be interpreted as date/time values. See Date/Time Values and SimpleDateFormats for more details concerning date and time values. For information on DECIMAL types see: Decimal Format Type.
The FormatExpr attribute of the Format parameter specifies a display format to be used for each axis tic label and each active label displayed generated by default. The format allows a developer to specify numeric and date/time formats using expressions similar to those provided in the C/Unix printf function. The format expressions can consist of an arbitrary string, plus one or more occurrences of format components, which are preceded by '%'.
The TimeBase and TimeUnit attributes are used only for the DATE format type. The TimeBase attribute specifies the base date to be used when determining the actual date/time value when a time unit or numeric value is used in the Scale, Scroll, or DataSet parameters. The TimeUnit attribute specifies the time unit multiplier to be used when determining the actual data/time value when a numeric value is used in the Scale, Scroll, or DataSet parameters. See Date/Time Values and SimpleDateFormats for more details concerning date and time values.
The following format components are supported for the numeric
format types:
| Format Type | Component(s) | Description |
| FLOAT | %f | Display numeric value with fixed number of decimal digits, possibly zero. |
| %g | Display numeric value using platform specific default format. Generally, this results in a "reasonable" format, unless a large number of decimal digits exists or the number is very large or very small. | |
| INTEGER | %d | Display numeric value as an integer, rounding if necessary. |
| DECIMAL | See: Decimal Format Type |
For the numeric types, the following modifier can be applied to the format component to yield different outputs:
-,0WW.DDwhere all parts are optional and are interpreted as follows:
| - | Left justify the result, otherwise right justify it. |
| , | Separate
the whole number into groups using the group symbol. By
default, a comma is used as the group symbol and the group
size is set to 3. The NumberFormat parameter can be specified to change the group symbol and/or the group size. If the group symbol is changed, then the same symbol should be specified in all format expressions in place of the comma. This option is ignored if zero padding is also specified. |
| 0 | Pad with leading zeros, if necessary, to fill entire field. |
| WW | Total width of the formatted field. If the field is naturally wider than this value, it is ignored. |
| . | Separate the whole
number from the decimal number using the decimal symbol.
By default, a period is used as the decimal symbol.
The NumberFormat parameter can be specified to change the decimal symbol. If the decimal symbol is changed, then the same symbol should be specified in all format expressions in place of the period. |
| DD | Number of decimal digits to display (%f format only). If not specified, the default number is 2. |
For example, for the
FLOAT value 1234.456, the following formats yield the result
shown:
| Format | Result |
| %g | 1234.456 |
| %f | 1234.46 |
| %,f | 1,234.46 |
| %d | 1234 |
| %,d | 1,234 |
| %8.1f | 1234.5 |
| %08.1f | 001234.5 |
| Cost=$%,.1fM | Cost=$1,234.5M |
The DECIMAL format type characters listed here are used in
non-localized patterns with two exceptions, the currency sign
and quote.
| Symbol | Location | Localized? | Meaning |
| 0 | Number | Y | Digit |
| # | Number | Y | Digit, zero shows as absent |
| . | Number | Y | Decimal separator or monetary decimal separator |
| - | Number | Y | Minus sign |
| , | Number | Y | Grouping separator |
| E | Number | Y | Separates mantissa and exponent in scientific notation. Need not be quoted in prefix or suffix |
| ; | Subpattern boundary | Y | Separates positive and negative subpatterns |
| % | Prefix or suffix | Y | Multiply by 100 and show as percentage |
| \u2030 | Prefix or suffix | Y | Multiply by 100 and show as percentage |
| (\u00A4) | Prefix or suffix | N | Currency sign, replaced by currency symbol. If doubled, replaced by international currency symbol. If present in a pattern, the monetary decimal separator is used instead of the decimal separator |
| ' | Prefix or suffix | N | Used to quote special characters in a prefix or suffix, for example, "'#'#" formats 123 to "#123". To create a single quote itself, use two in a row: "# o''clock" |
More information on the DecimalFormat class can be found at http://java.sun.com/j2se/1.3/docs/api/java/text/DecimalFormat.html.
NumberFormat
NumberFormat = ("decimalSymbol", "groupSymbol", groupSize);
The NumberFormat parameter can be used to specify the symbols and group size used when formatting numeric values. The default decimalSymbol is ".", the default groupSymbol is "," and the default groupSize is 3.
International numeric formatting is easily accomplished by reversing the symbols and specifying appropriate format expressions. For example, for the following NumberFormat definition:
example: NumberFormat = (",", ".");
would generate the following results for the given format for the decimal value 1234.456:
| Format | Result |
| %f | 1234,46 |
| %.f | 1.234,46 |
| %d | 1234 |
| %.d | 1.234 |
| %.8,1f | 1.234,5 |
| %08,1f | 001234,5 |
Date/Time Formats
The following formats are supported
for the DATE format type:
| %L | standard Java locale format ('Mon Jan 01 00:00:00 1996') |
| %G | standard Java GMT format ('1 Jan 1996 00:00:00 GMT') |
| %Y | year as YYYY (1900+) |
| %y | year as YY (00-99) |
| %M | month as MM (01-12) |
| %N | long month name ("January", "February", ...) |
| %n | short month name ("Jan", "Feb", ...) |
| %W | long weekday name ("Sunday", "Monday", ...) |
| %w | short weekday name ("Sun", "Mon", ...) |
| %d | day of month as DD (01-31) |
| %h | hour as HH (00-23) |
| %m | minute as MM (00-59) |
| %s | second as SS (00-59) |
For example, for the
DATE value '10 April 1996 12:37', the following formats yield
the result shown:
| Format | Result |
| %L | Wed Apr 10 12:37:00 1996 |
| %M/%d/%Y\n%h:%m:%s | 04/10/1996 12:37:00 |
| %N %d, %Y | April 10, 1996 |
SimpleDate Formats
The following formats are supported for the SimpleDate format type:
| G | era designator (AD) |
| y | year (1999) |
| M | month in year (July & 07) |
| d | day in month (10) |
| h | hour in am/pm (1-12) |
| H | hour in day (0-23) |
| m | minute in hour (30) |
| s | second in minute (54) |
| S | millisecond (978) |
| E | day in week (Tuesday) |
| D | day in year (180) |
| F | day of week in month 2 (2nd Wed in July) |
| w | week in year (26) |
| W | week in month (3) |
| a | am/pm marker (PM) |
| k | hour in day (1-24) |
| K | hour in am/pm (0-11) |
| z | time zone (Pacific Standard Time) |
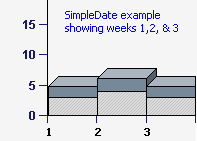
For example, the CDL Parameter BottomFormat
= (SIMPLEDATE,"F") will display:
Examples
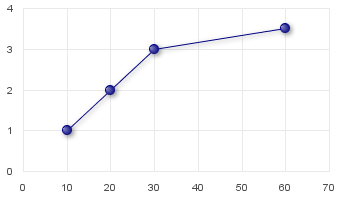
This example shows an XY chart with the following left and bottom axes:
LeftScale   = (0,4);
BottomScale = (0,70);
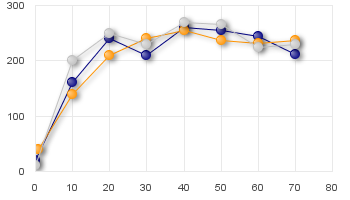
This example shows an XY chart, with the following axis parameters specified:
BottomTics  = ("", x000000_178, "Arial Plain", 10, 0, CENTER, , CENTER);
BottomScale = (0,80,null);

LeftTics    = ("", x000000_178, "Arial Plain", 10, 0, CENTER, , CENTER);
LeftScale   = (0,300,null);
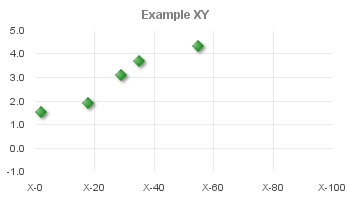
This example shows an XY chart, with the following axis parameters specified:
LeftFormat = (FLOAT,"%.1f",null,null);
LeftScale  = (-1,5,1.5);
LineSet1   = (2,1.5),(18,1.9),(29,3.1),(35,3.7),(55,4.3);
LineSets   = ("LineSet1", );
LineSymbol = (DIAMOND, 12, FILLED, , 1, , green, 0);
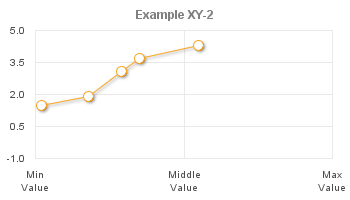
This example shows an XY chart, with the BottomLabels parameter used to define three custom tic labels
LeftScale    = (-1, 5, 1.5);
BottomScale  = (0, 100, 20);
BottomLabels = "Min\nValue", "Middle\nValue", "Max\nValue";
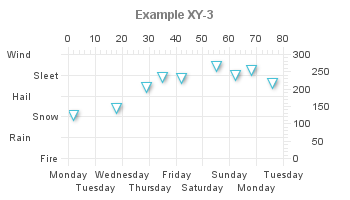
This next XY chart demonstrates a variety of tic label layouts. On the bottom axis, AUTO is used to automatically stagger and skip labels so that none overlap. The left axis uses a 2 level STAGGER. The top axis shows an implementation of minor tics using the SKIP parameter, and the right axis demonstrates the combined SKIPSTAGGER effect.
LeftScale       = (-1,5,1.5);
LeftTicLayout   = (STAGGER,0,2);
LeftFormat      = (FLOAT,"%.1f",null,null);
LeftTics        = ("", x000000_178, "Arial Plain", 10, 0, CENTER, , CENTER);
RightTics       = ("", x000000_178, "Arial Plain", 10, 0, CENTER, , CENTER);
RightScale      = (0,300,10);
RightTicLayout  = (SKIPSTAGGER,4,2);
TopTics         = ("", x000000_178, "Arial Plain", 10, 0, CENTER, , CENTER);
TopScale        = (0,80,2);
TopTicLayout    = (SKIP,4,1);
BottomTicLayout = (AUTO,0,1);
BottomTics      = ("", x000000_178, "Arial Plain", 10, 0, CENTER, , CENTER);
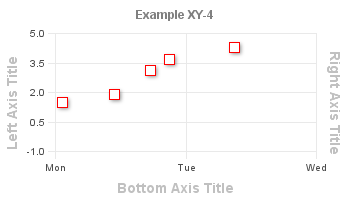
This example shows an XY chart which uses the axis title parameters to define separate axis titles:
LineSet1   = (2,1.5),(18,1.9),(29,3.1),(35,3.7),(55,4.3);
LeftTics   = ("", x000000_178, "Arial Plain", 10, 0, CENTER, , CENTER);
LeftTitle  = ("Left Axis Title", silver, "Arial", 14, 90, null, CENTER, "OFF");
RightTitle = ("Right Axis Title",black,"Arial",10,270);
Footer     = ("Bottom Axis Title",slategray,"Arial",10,0);
 CDL example:
LeftFormat = (DECIMAL, "$###,###", , );